
Gantt Charts have established themselves as indispensable assistants in project management. .
If you are still not taking full advantage of their potential, it is high time to become better acquainted with the Redmine Gantt.
With this material, you will learn:
What is a Gantt Chart?
A Gantt Chart is a popular project management tool designed to demonstrate how planned work (tasks or events) is performed over time. This technique of visualization normally consists of two parts: the left side shows a set of scheduled activities while the right one includes a suitable time scale with bars representing the work. Besides, Gantt charts can include start and end dates, task interdependencies, assignees and checkpoints.
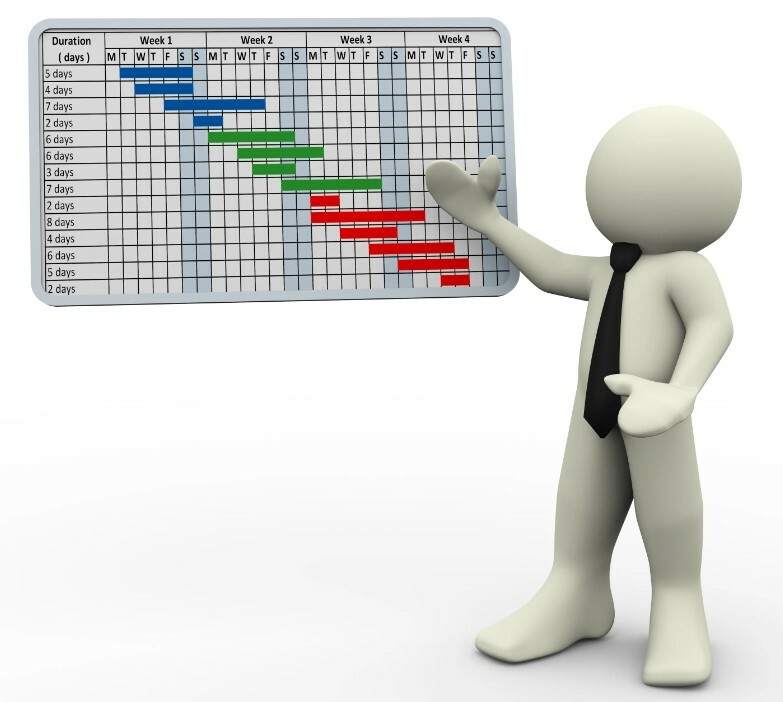
Note: The work is represented on the vertical axis whereas the timeline is depicted as horizontal bars varying in length. The bar length is directly proportional to the time needed for a task or event’s realization.
Why is it called so?
Originally, the idea was invented in 1896 by a Polish engineer Karol Adamiecki, who devoted much of his life to the steel-making industry. He called it a harmonogram. However, Adamiecki published his scientific papers only in Polish and Russian, little known in the English-speaking world. For this reason, it was an American mechanical engineer Henry Gantt who made the revolutionary concept public domain in 1910 and, therefore, immortalized his proper name in history.
Nowadays, Gantt Charts are widely used to create Agile roadmaps. These are flexible and practical blueprints for achieving your project goals, i. e. business plans with all the project key milestones and goals.
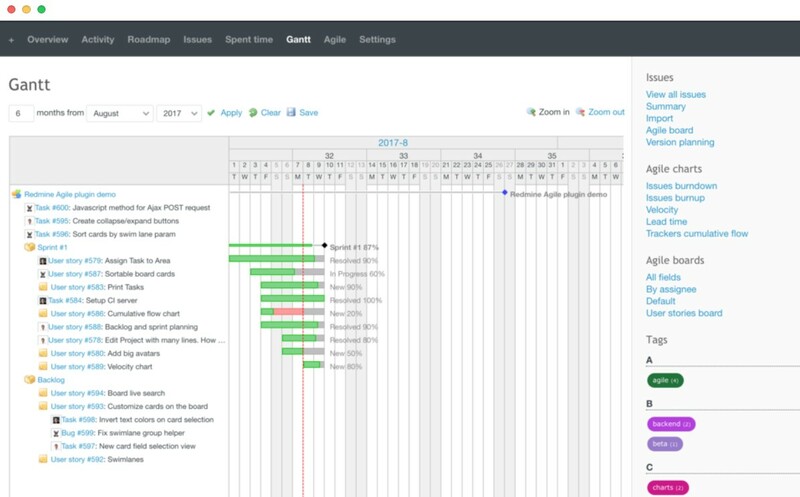
Needless to say, Redmine keeps up with the market's demands, so the project management system could not get past such a powerful and economically sound feature. Thus, our Redmine Agile plugin comes with built-in road maps and Gantt for planning sprints to give you in-depth knowledge of what is planned and what is being delivered.
Migrate to secure hosting
Don't waste your time on Redmine maintenance. Hire experts and focus on your projects
Jira Gantt Chart vs Redmine Gantt Chart
There is no doubt that both Jira and Redmine are big sharks on the project management market. Now we suggest comparing what these two popular platforms offer users in terms of the Gantt methodology.
Jira Gantt Chart: The Case of BigGantt
- drag & drop feature
- auto-scheduling
- critical path graph
- alert system for delayed tasks
- "what-if" scenarios
Redmine Gantt Chart: The Case of RedmineUP
- drag & drop interface
- task editing directly from the Gantt chart
- critical path graph
- filtering and sorting features
- zooming in/out options
Hence, although we have not mentioned the whole list of their features, you can see that both tools are offering pretty much the same functionality. However, what differs is the price. Only one Jira’s plugin costs you 1250$ per year while Redmine will set you back 2028$ with full stack plugins bundle. Do you feel the real profit?
Redmine Gantt Chart Benefits
1. It enables effective project organization with a user-friendly interface
By creating projects with the Gantt method, you can accurately gauge the productivity of your team and set adequate deadlines. Equally important, it comes with a visually appealing, intuitive design. You may see the percentage of tasks completed at any time and check the status of the project to keep up to date.
2. It makes projects agile and transparent
You are able to understand your schedule and, if necessary, make changes. If something unexpected happens, it is easier than ever to take appropriate action in time. What is more, the Gantt visual clarity optimizes project team management, allowing team members to stay focused and not be overwhelmed by too many tasks.
3. It determines project requirements
Gantt charts are designed to identify milestones, dependencies, stages and highlight major issues when planning long-term projects. You may easily illustrate task dependencies. For example, by showing on a chart how the beginning of one task can depend on the ending of another. This information allows managers to plan work and allocate resources in a way that does not interfere with project progress.
Migrate to secure hosting
Don't waste your time on Redmine maintenance. Hire experts and focus on your projects
4. It boosts team productivity and motivates users
The online chart gives team members the ability to collaborate efficiently and concentrate on the tasks they need to complete. Thus, Gantt affects the quality of team accountability as well as their involvement. Users can track project progress and monitor how others are performing their tasks.
Interesting? Then Act!
Have you ever created a Gantt Chart? If not, we are delighted to inform you that we have a special offer for you: 15 days absolutely for free. No question, RedmineUP is worth using!