
No matter whether for in-house use or in relations with the clients, SLA or Service Level Agreement is your codex and binding agreement for the quality of services. Let's see how to use productivity metrics to keep a hand on the pulse of your team performance. .
SLA is one of the most popular categories of agreements set up to determine levels of desired quality, availability of support and responsibilities of the servicing party. After defining the scope of work, assignments, setting up priorities, reporting it comes a time to define the KPI. Helpdesk plugin offers insights into three key metrics, which allow you to keep track of your team's work effectiveness.
These metrics are:
- time to first response
- time to reaction
- time to resolve
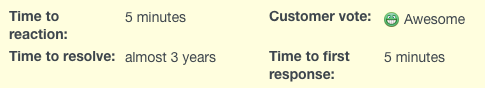
- Time to first response shows you how much time passed between the creation of the ticket and the first response. It is counted up to the moment of sending a reply to the customer.
- Time to reaction shows how much time passed between ticket creation and the first action taken in this ticket. It can be understood as: commenting, assigning the ticket to someone, attaching a file, etc.
- Time to resolve shows how much time was spent before the ticket got marked as Resolved or Closed.
To use the metrics, you create and run a custom query, using above metric(s) as filters. As Redmine does not support automatization of custom queries, it has to be executed by you. The positive side is that it enables you to use other filters to immediately investigate problems with the tickets that do not fit to the given parameters, for example, exceeds time to response. Example of such a query can be found there. What is more, the results of the SLA query can be exported from the system into .csv or .pdf file.
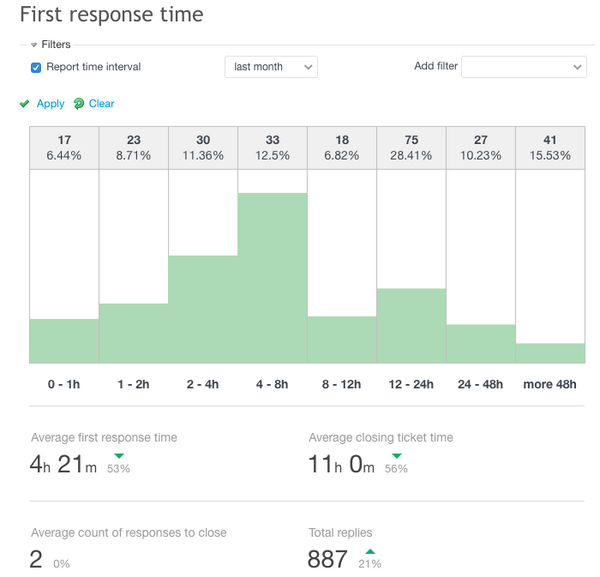
Helpdesk also gives you access to reposts for first two metrics mentioned above. Let's take a look at the first one: First response time report shows you how much tickets received an answer in particular time slots. Below the report you also see average time to first response, average ticket closing time, a total number of tickets received and how many replies it takes on average to close the ticket.
The next report, the busiest time of the day, shows you a number of tickets received in particular 2h periods of the day. It also shows how many new tickets from new contacts were created.
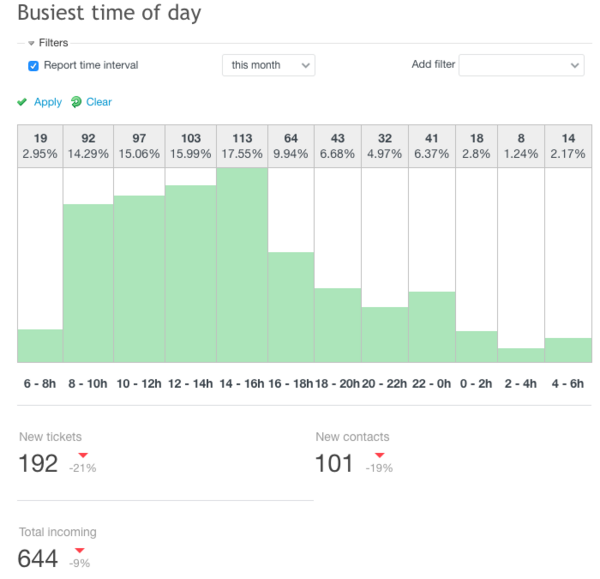
Both reports shows can be shown for the period of today, yesterday, this week, last week, last two week, current month, previous month and current year. Each report compares data for given length of the period and compares it with the last period.
Migrate to secure hosting
Don't waste your time on Redmine maintenance. Hire experts and focus on your projects
Using the metrics with Helpdesk SLA filters is just the beginning of the process implementation. In a future version of the plugins, we will be further developing this functionality feature is only the first step to an effective SLA in your company. Let us know in the comments, which metrics or SLA solutions would be most helpful for you.
