You need the View planner permission. Open the project and select Planner in the project menu.
The chart shows a task table on the left and a timeline on the right. It is built on an issue query: the filters, saved queries and the sidebar work as on the issues list. Queries are only applied here, never saved from Planner.
Rows and hierarchy
Every issue is a row. Children are indented under their parent and keep the order of the core Gantt (start date of the ancestors, then id). Use the arrow in front of a parent to collapse or expand its subtree, and Collapse all and Expand all in the header for the whole chart. A collapsed subtree stays collapsed when its parent is expanded again.
The project page shows the project and, as your query says, its subprojects. The global Planner page shows all issues you can see. The number of rows is limited by the core setting Maximum number of items displayed on the gantt chart (Administration, Settings, Issue tracking); the chart tells you when it is truncated.
Bars
| What you see | What it means |
|---|---|
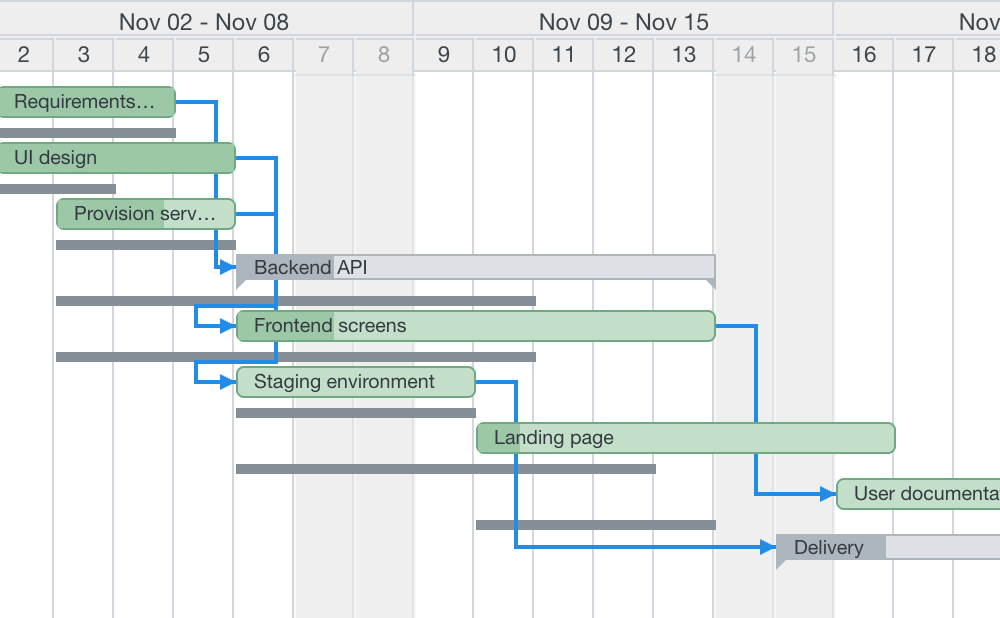
| Green bar | The issue from its start date to its due date. The darker part inside is the done ratio. |
| Yellow bar | The issue has a Draft change. The previous dates of the issue stay visible as a thin grey line below the bar. |
| Pale grey bar with corner marks | Summary bar of a parent whose dates are calculated from its subtasks (Redmine setting Parent tasks attributes). It spans its children and cannot be dragged. |
| Bar with a dashed, rounded side | The issue has only one date. It is drawn as a one-day bar. |
| No bar | The issue has no dates. Hover the row to create them, see Edit on the chart. |
| Closed issue | The same bar with a grey border; the subject is struck through. |
| Red dashed vertical line | Today. |
Hover a bar for a tooltip with the core issue fields and Estimated time. Dates, estimate and assignee show the Draft value, and the value Redmine holds is struck through in grey before it. The project is listed only when the chart shows more than one.
Bar labels
The label inside a bar shows the subject by default. PRO In Options, Bar labels you can show the id, subject, estimated time and assignee. Draft values are in italics. Labels are cut with an ellipsis and are not drawn on bars narrower than 40 pixels.
Scale and range
In Options, Scale chooses the width of a column: Months, Weeks or Days. The header has two rows (year and month, month and week, week and day). Non-working days are shaded at the Days scale.
| Scale | Column | Default range |
|---|---|---|
| Months | 60 px per month | 24 months |
| Weeks | 70 px per week | 6 months |
| Days | 30 px per day | 2 months |
The range starts at the date next to months from, snapped to the week (days and weeks) or to the month, and covers the given number of months. Previous and Next move it by its length. Scale and number of months are remembered per user.
Bars outside the range
- A row whose bar is entirely before or after the range shows a grey chevron at the edge of the visible area when you hover it. Click it to move the range to the bar.
- A bar that crosses an edge is clipped there and has a chevron inside the bar. The left chevron moves the range to the bar's start; the right one moves it so that the bar's end is about a week before the range end. The tooltip of the chevron shows the dates.