From Reporter 2.2.0, the chart tag draws a chart inside a report. A chart is an SVG picture without scripts and external fonts, so it looks the same on the Preview tab, in the PDF and in an e-mail.
- Try the examples
- Add a chart to a template
- Chart types
- Several series
- Use the data of the report
- Attributes
- Related articles
Try the examples
The file below is a template that shows every chart type and attribute, with the source above each chart.
- Select Administration, then Plugins, then Reporter, then Configure, and open the Report templates tab.
- Click Import and choose the downloaded file.
- Open the imported template Charts showcase and click the Preview tab.
Add a chart to a template
Write the chart between the opening and the closing tag and give it the data as lines "label: number":
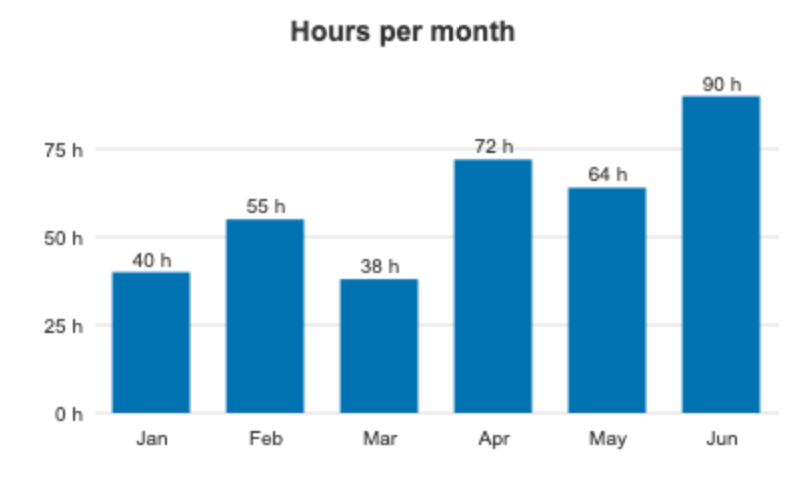
{% chart type: 'column', title: 'Hours per month', unit: 'h' %}
Jan: 40
Feb: 55
Mar: 38
{% endchart %}
The body is processed by Liquid first, so you can build the lines in a loop. Numbers use a dot. A line without a colon is ignored.
Chart types
| Type | What it draws |
|---|---|
bar (default) |
Horizontal bars; several series are grouped |
column |
Vertical columns on an axis with grid lines; several series are grouped |
line |
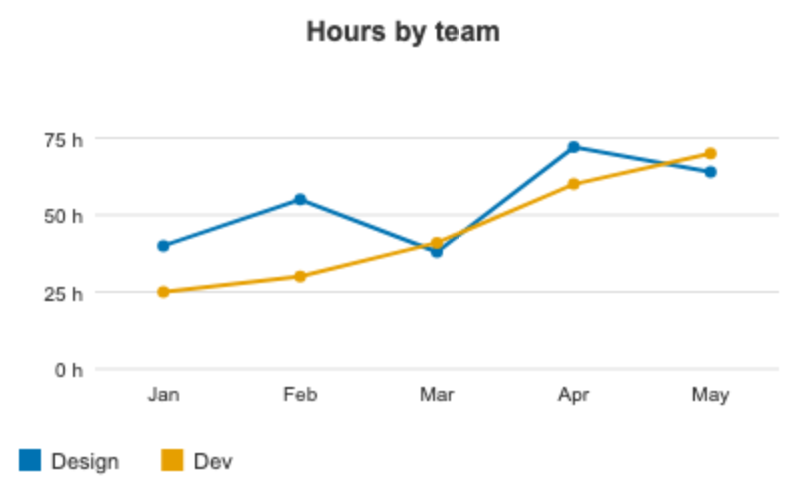
One line with points per series |
pie, donut |
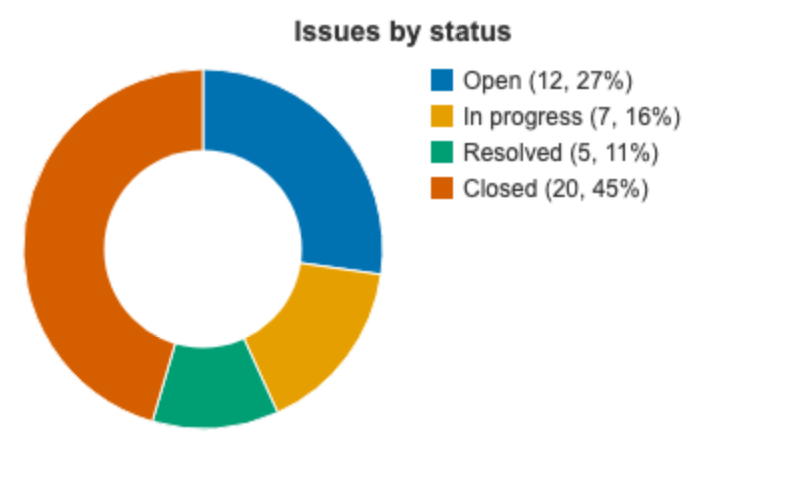
A slice per label, with a legend that shows the value and the percent |
stacked |
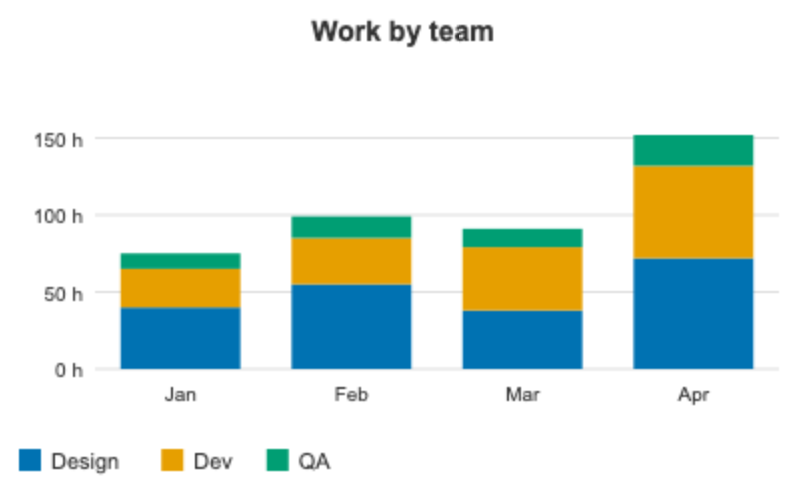
Stacked columns, one segment per series |
 |
 |
 |
 |
Several series
Start the body with a line series: and the names of the series, then give one number per series in every line. A legend is shown for several series.
{% chart type: 'line', title: 'Hours by team', unit: 'h' %}
series: Design, Dev
Jan: 40, 25
Feb: 55, 30
Mar: 38, 41
{% endchart %}
Use the data of the report
Instead of the body you can pass ready data with the data attribute. For example, the hours spent on the issues of the report, by date:
{% assign d = issues.spent_time_by_date %}
{% chart type: 'column', title: 'Spent time by date', unit: 'h', data: d %}{% endchart %}
data accepts a hash label => number, a hash of hashes for several series, an array of [label, number] pairs, or an array of hashes with name and size such as the result of group_by_custom_field. When you use data, leave the body empty.
Attributes
| Attribute | What it does |
|---|---|
type |
bar, column, line, pie, donut or stacked; an unknown value draws bar |
data |
Ready data instead of the body |
title |
The title above the chart |
width, height |
The size in pixels: width 120 to 2000 (600 by default), height 60 to 2000 |
colors |
A comma separated list of colors, as #0072b2 or color names |
legend |
false hides the legend |
labels |
false hides the value labels |
unit |
A suffix for the numbers, for example h |
radius |
The radius of a pie or a donut |
The default colors are chosen to be distinguishable for color-blind readers and in a grayscale print. A chart without data shows a "no data" text, and a negative or not numeric value is drawn as 0.
Related articles
- Template editor and live preview
- Reporter template syntax
- AI assistant for report templates: the assistant draws charts with this tag