
- Open the reports
- Filters and interval
- Response and resolution time
- Ticket load by time
- Contact satisfaction
- Ticket volume and backlog
- Contact activity
- Tags
Helpdesk reports show how your support team works: how fast it answers, when tickets arrive, how many tickets are created and resolved, how satisfied contacts are, and which contacts and tags generate the most work. There are six reports.
Open the reports
You need the View reports permission in your role. For a project report, the Helpdesk module must be enabled in the project.
To open the reports of a project:
- Open the project and select Issues.
- Select the Actions menu in the top right corner, then Helpdesk reports.
The first report, Response and resolution time, opens. To see the data of all projects you can access, open the Issues list outside any project (Issues in the top menu) and select Actions, then Helpdesk reports.
To switch to another report, use the select under the page title. The filters are kept when you switch. The breadcrumb above the title (All projects, then the project name) shows the scope of the data.
The reports are:
- Response and resolution time
- Ticket load by time
- Contact satisfaction
- Ticket volume and backlog
- Contact activity
- Tags
Filters and interval
All reports share the same filters:
- Report time interval (the period), Assignee, Source, Priority, Tracker.
- Contact company, Contact and Author of the ticket.
- Tags (when the Tags plugin is installed), Category (inside a project), custom fields of issues and of contacts.
The Interval select next to the filters sets the step of the trend charts: day, week, month, or Auto. The tiles above the charts show the change against the previous period of the same length: green means a good direction, red a bad one. Days and hours are counted in your time zone.
Response and resolution time
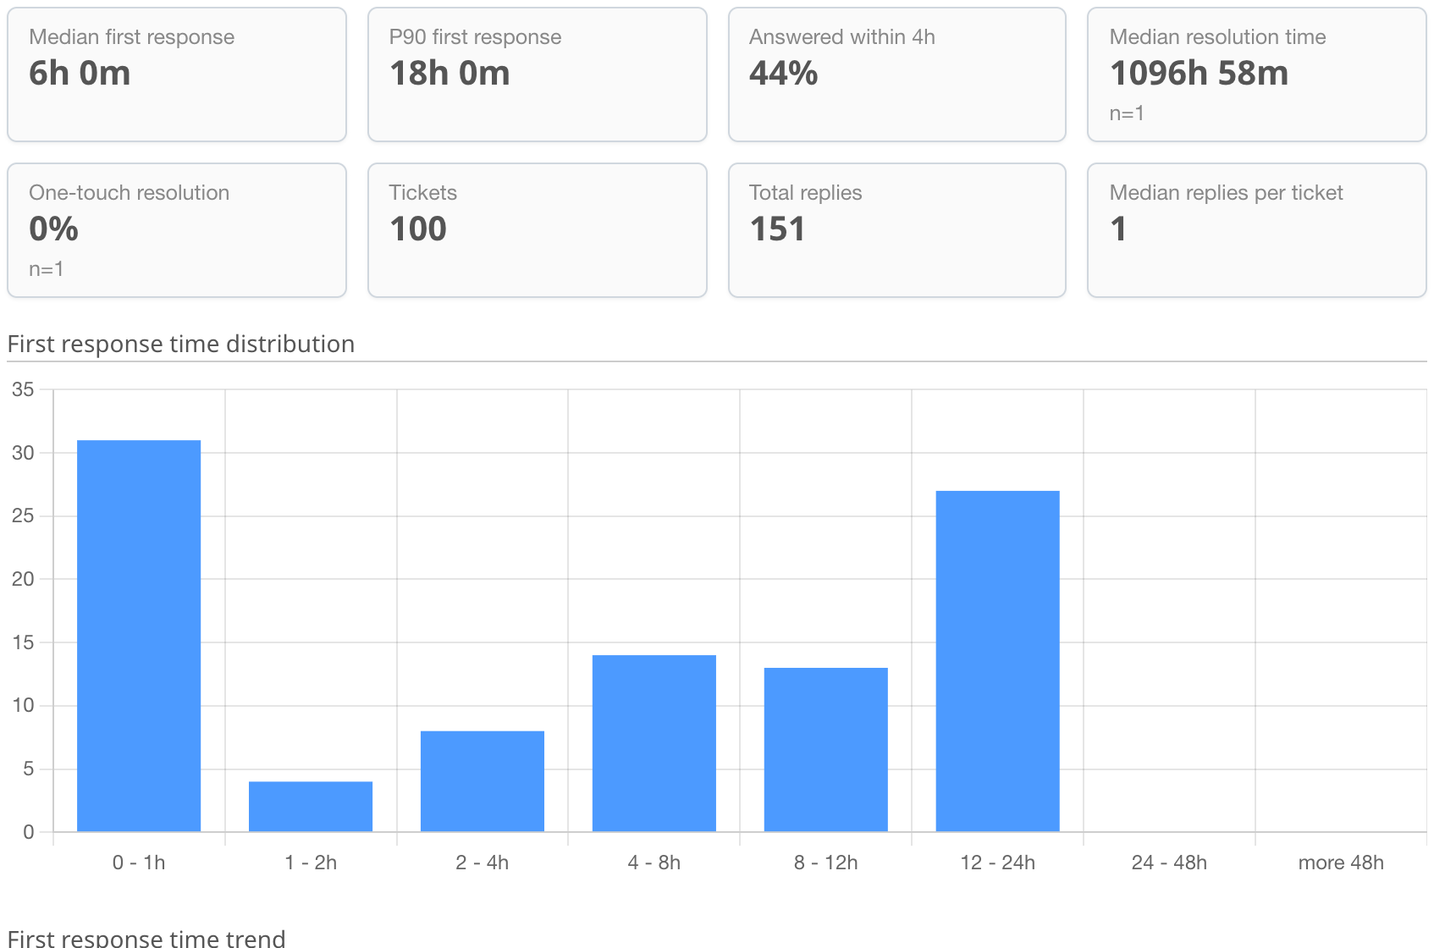
This report shows how fast the team answers and how long tickets take to close. Assigning a ticket or moving it without sending an answer is not counted as a first response.
- Median first response and P90 first response: half of the tickets got their first answer faster than the median; 90% got it faster than P90.
- Answered within 4h: the share of tickets with a first response in 4 hours. The target is fixed.
- Median resolution time and One-touch resolution (the share of tickets closed with a single reply).
- Tickets, Total replies and Median replies per ticket.
The charts show the distribution of first response times, the trend of tickets and the median, the distribution of resolution times, replies per ticket, and breakdowns by assignee and by source. Medians and percentiles use the nearest-rank method. A tile based on fewer than 30 tickets carries a note like n=12: treat it as a hint, not a statistic.
Ticket load by time
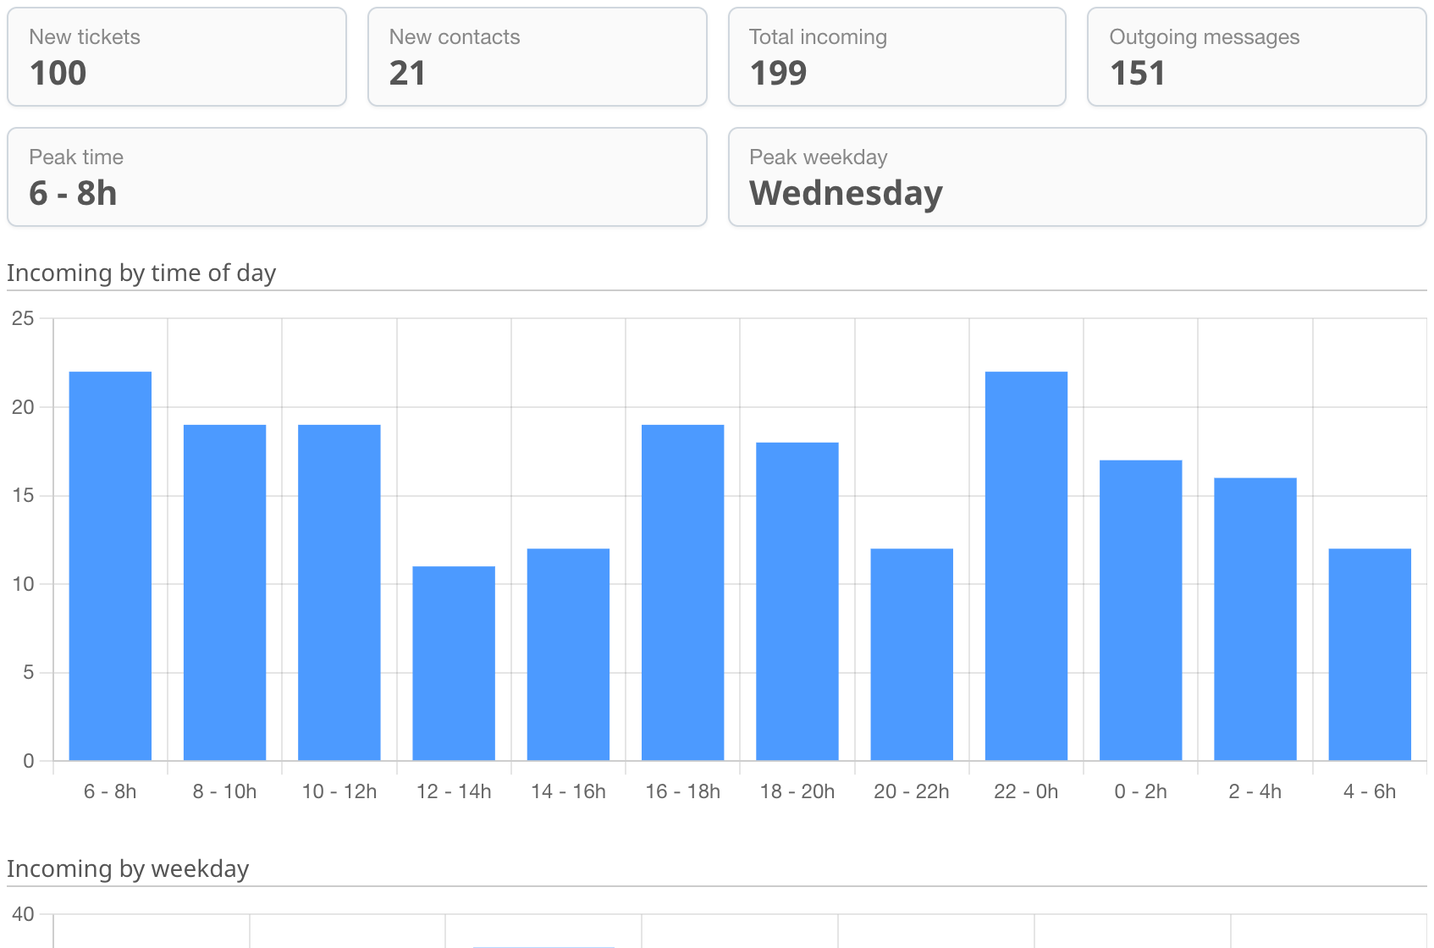
This report shows when the work arrives, so you can plan shifts. It counts new tickets, new contacts, incoming and outgoing messages.
- Tiles: New tickets, New contacts, Total incoming, Outgoing messages, Peak time and Peak weekday.
- Charts: activity in two-hour slots of the day, by weekday, incoming against outgoing messages over time, and by source.
Contact satisfaction
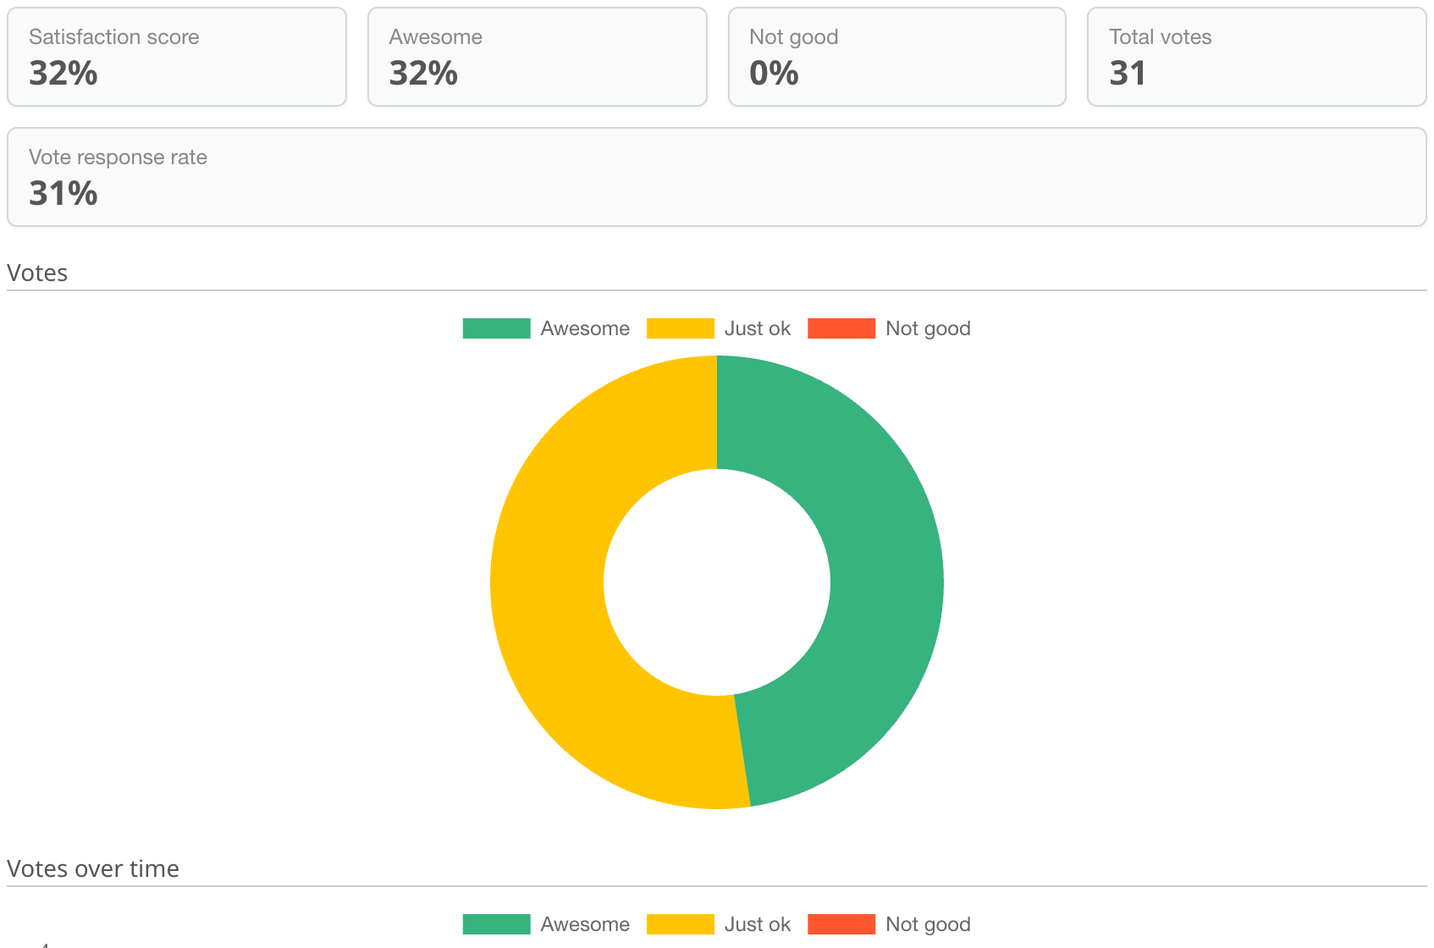
This report uses the votes customers leave on your replies (Satisfaction votes).
- Satisfaction score is the share of Awesome votes minus the share of Not good votes. Example: 32% awesome and 0% not good give a score of 32%.
- Awesome, Not good, Total votes and Vote response rate (the share of tickets that received a vote).
- Charts: votes, votes over time, score by assignee and by source.
Ticket volume and backlog
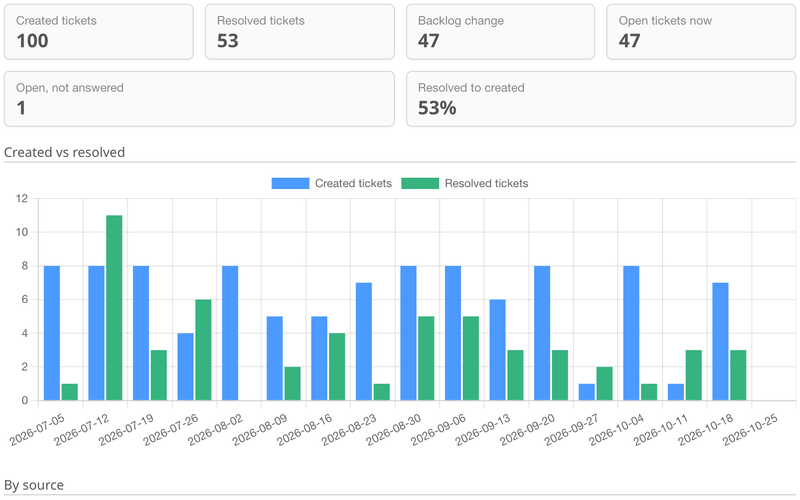
This report answers the question "is the team keeping up?". It compares tickets created in the period with tickets resolved in the same period.
- Created tickets and Resolved tickets in the period.
- Backlog change is created minus resolved. A positive value means the queue grew.
- Open tickets now and Open, not answered (open tickets without a reply).
- Resolved to created is the resolution rate.
Example: 100 tickets were created and 53 were resolved. The backlog grew by 47 tickets and the resolution rate is 53%.
Charts: created against resolved over time (by day, week or month), tickets by source, and resolved tickets by assignee.
Contact activity
This report shows which contacts and companies create the most work.
- Tiles: Active contacts, Created tickets, Tickets per contact, Total messages (tickets plus incoming messages) and Top contact share (the share of tickets from the most active contact).
- Charts: By contact and By company, 10 items each. Every bar shows created tickets and total messages. A company is the company of a person or a contact marked as Company.
Tickets without a contact are not counted. To see the tickets of one contact, open the contact and select the Helpdesk tickets tab: it has a summary (tickets, open tickets, average first response, average time to resolve, last ticket), search, and filters by status and period.
Tags
This report shows what your tickets are about.
- Tiles: Created tickets, Tickets with ticket tags and Tickets with contact tags.
- Charts: By ticket tag and By contact tag, top 10 each. A ticket counts once for every tag it has.
Ticket tags need the Tags plugin. Without it, only contact tags are shown. A chart without data is hidden.
Before version 4.5.0 the tag charts were part of the Ticket volume and backlog report. Now they are in Tags.